
k8s 部署 prometheus
看到很多部署 prometheus 到 k8s 集群的教程,发现都是非常麻烦的各种配置,懒人的我就想整个一键部署的,开箱即用的,既然有了 helm 那肯定只要一个 charts 就可以搞定了吧,想着就是这样,所以在网上找来找去,终于被我发现了。下面记录一下使用过程,方便以后进行部署。
PS: 本文适用于开发者单 k8s 集群部署 prometheus,如果是运维可建议进行独立部署,一方面不需要占用集群内部资源并保证多活,另一方面可以支持多集群扩展。
安装
1 | helm 添加对应 repo |
默认用户名密码
admin/prom-operator
也可以通过下面的命令进行查看
kubectl get secret --namespace <YOUR-NAMESPACE> prometheus-grafana -o jsonpath="{.data.admin-password}" | base64 --decode ; echo
展示
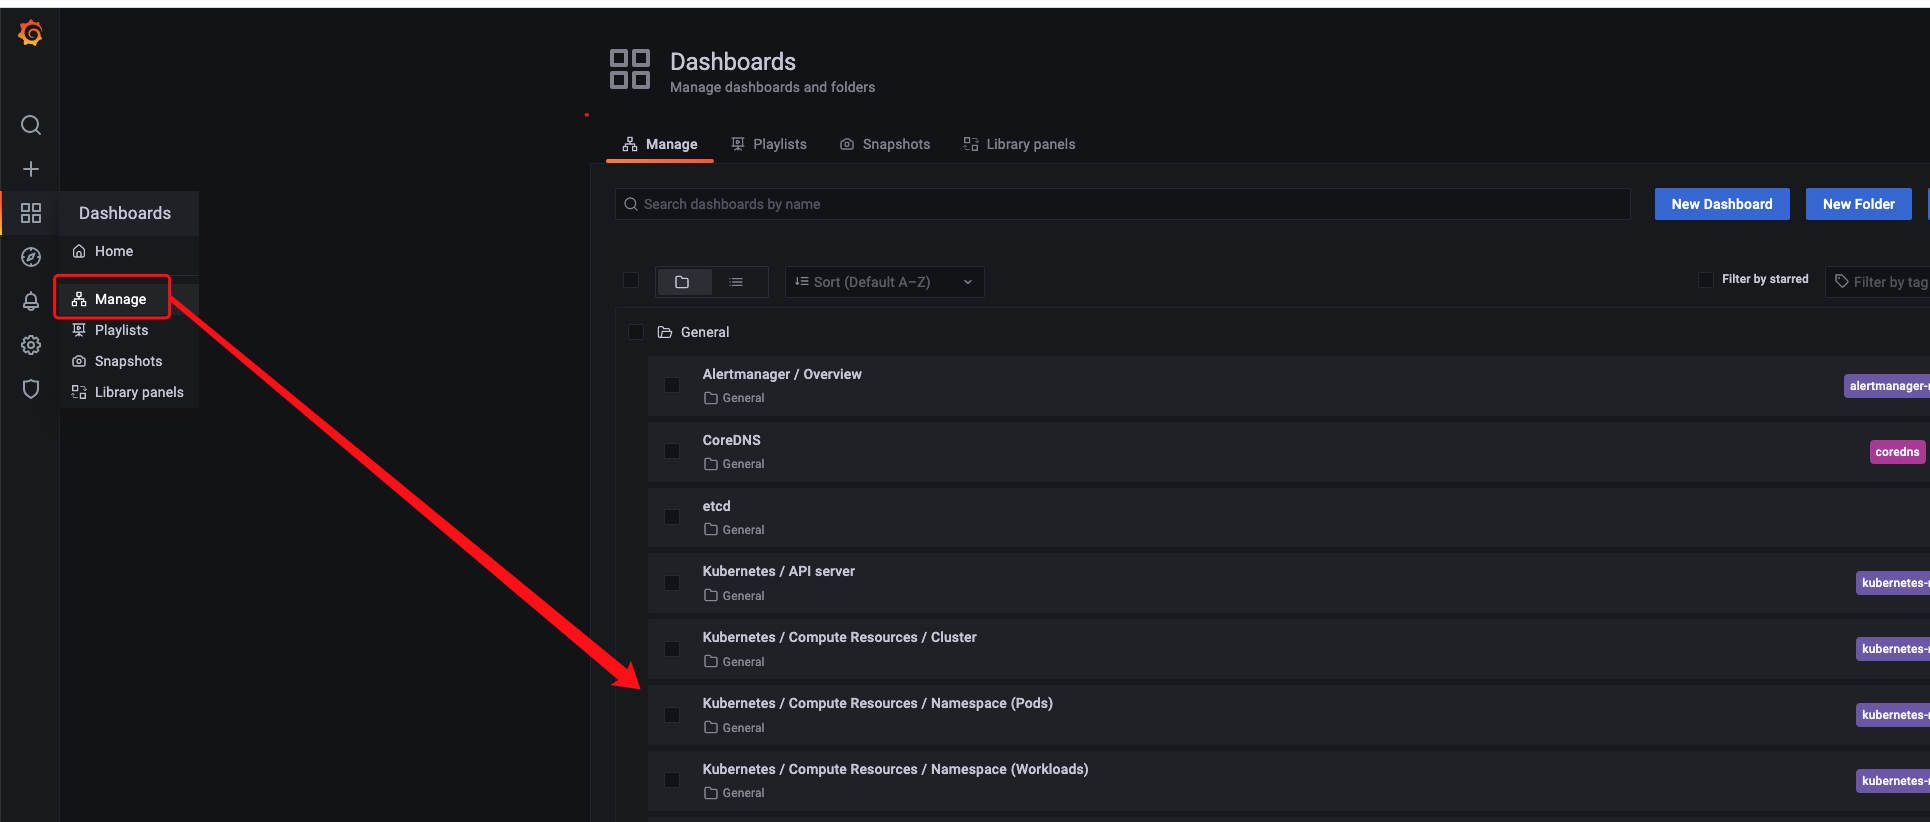
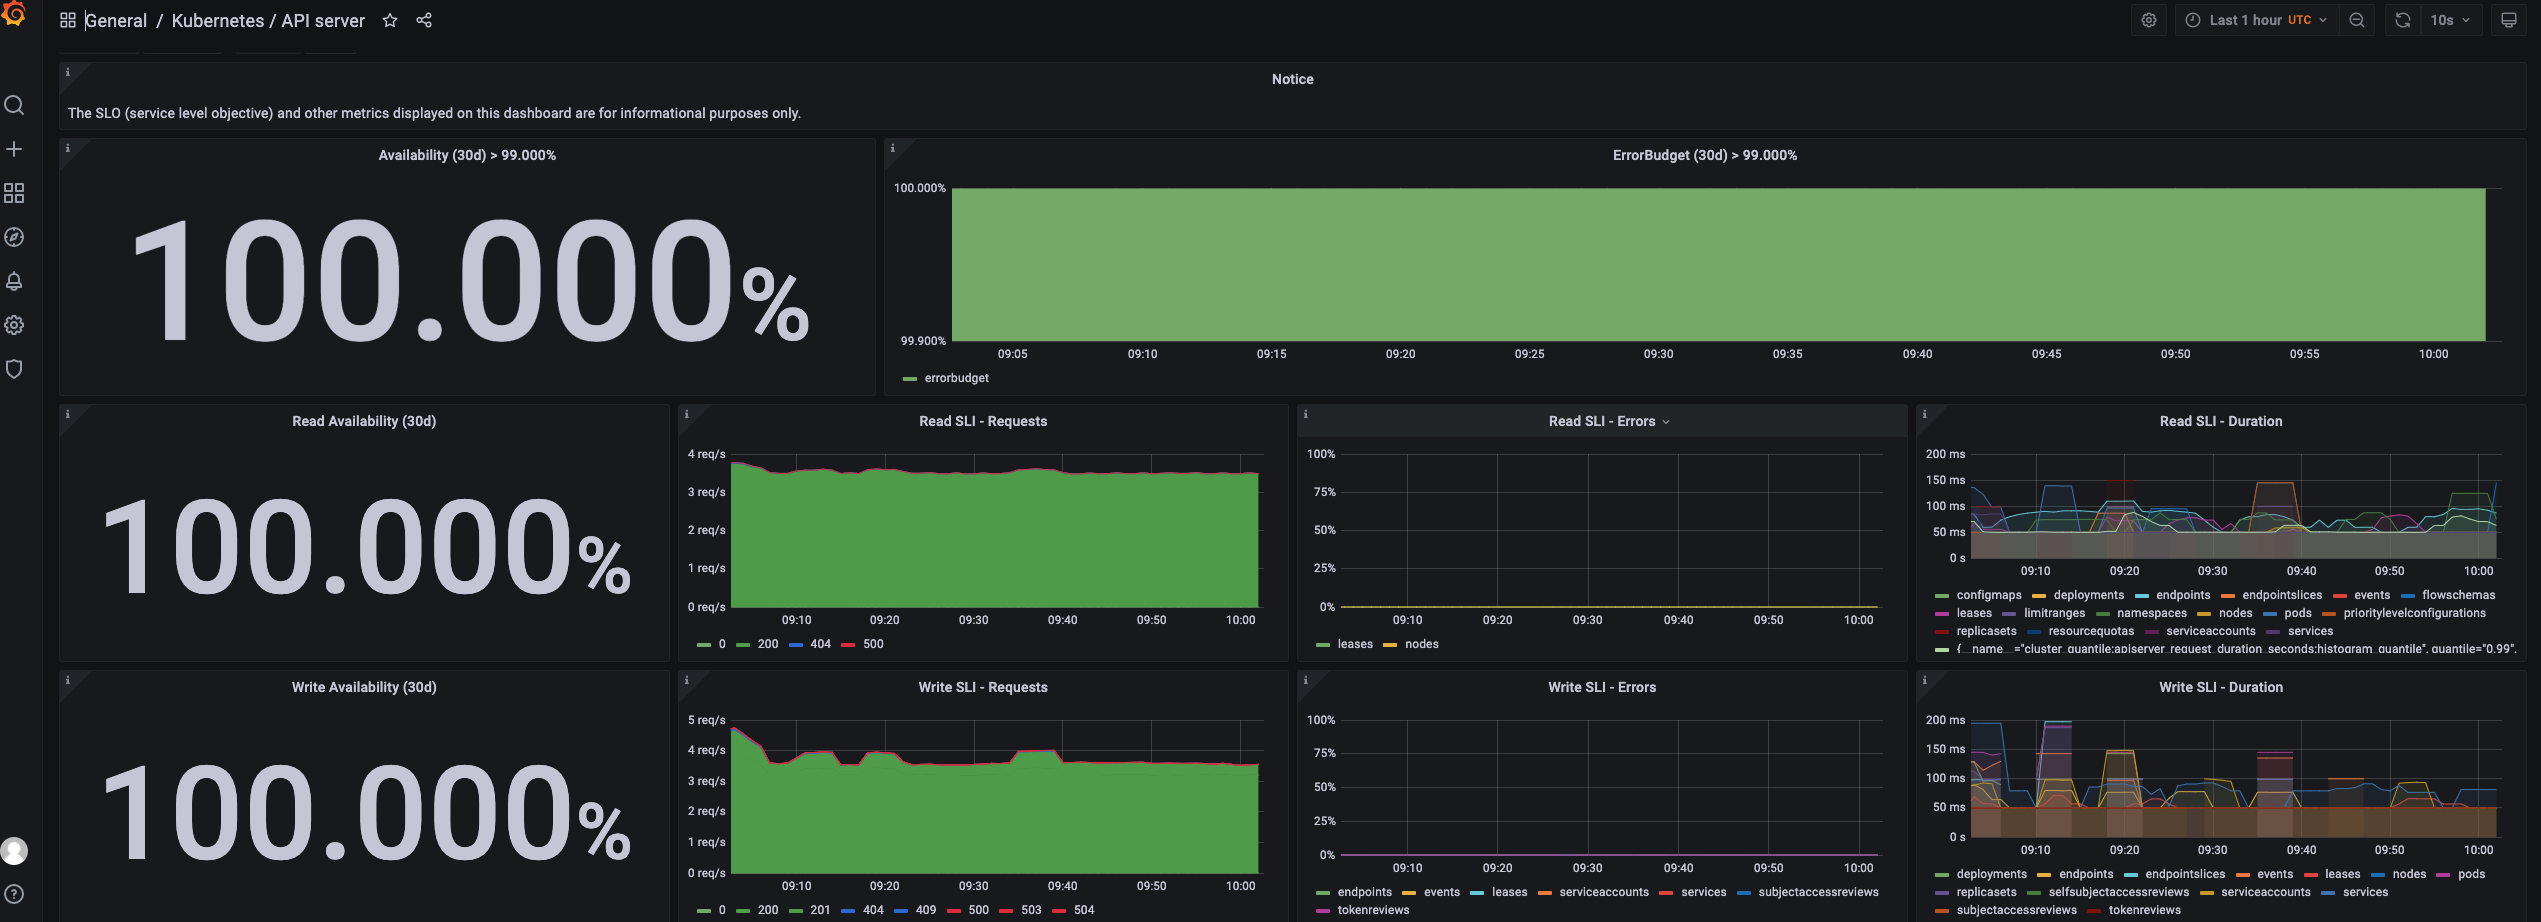
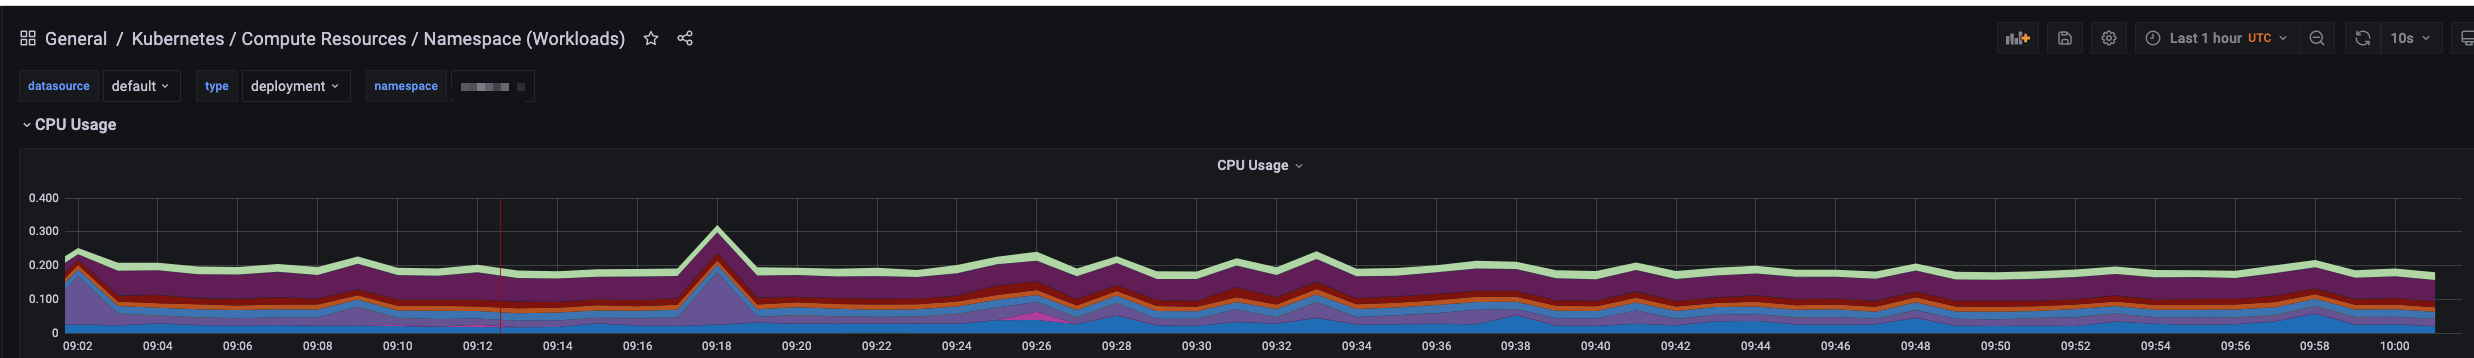
至此,我们针对各个 k8s 内资源的监控都已经有了,所有相关 pod 的使用情况都能被监控到
go 应用接入
当然有的时候我们需要采集某个应用单独的相关指标,通常这些指标会通过 prometheus 的 client 暴露 metrics 接口让 prometheus 去采集相关指标和信息。我们手动部署 prometheus 的时候,当部署完成之后需要手动修改配置文件中的采集目标配置对应的 job,而这样对于使用起来比较繁琐,毕竟每次都需要修改配置,而且配置还很多。
而当我们使用 k8s 部署 prometheus 的时候就会发现这件事很容易了。
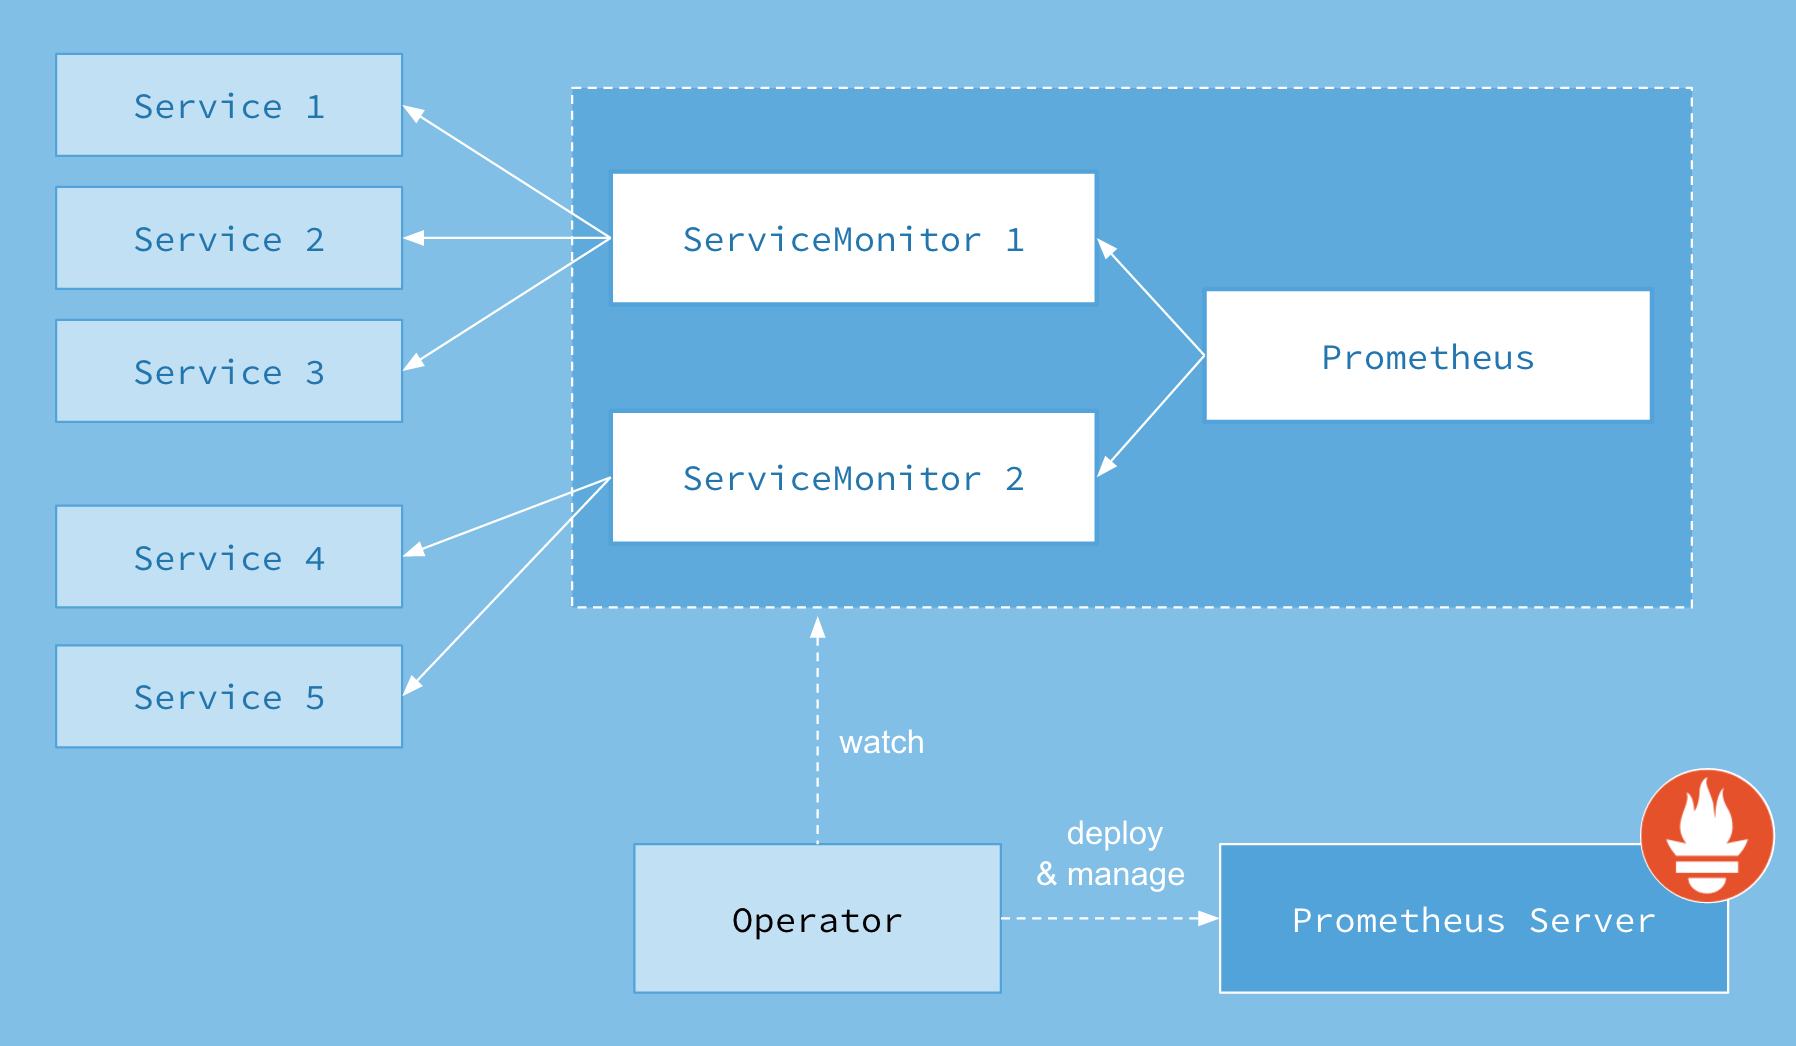
图中,service 就是我们 k8s 中的 service 资源,而 prometheus 就是通过 ServiceMonitor 来实现的 ServiceMonitor 是它自定义的一种资源,就类似 deployment 只不过是自定义的而已
代码引入
使用非常简单,只需要引入官方提供的 client 就可以然后暴露对应的 metrics 接口就可以了
1 | package main |
资源配置
对于你应用 service 配置这里就不展开了,你需要根据个人情况配置,无论是 nodeport 还是 lb 都可
1 | apiVersion: monitoring.coreos.com/v1 |
当然还有一种选择是你使用 PodMonitor 去监控,配置也是类似的,详细看一下官网给出的配置 https://github.com/prometheus-operator/prometheus-operator/blob/main/Documentation/user-guides/getting-started.md
当配置完成之后 apply 过一会就能从 prometheus 控制台看到监控的 target 了(监控的控制台页面本身没有暴露,需要你自己暴露 service)
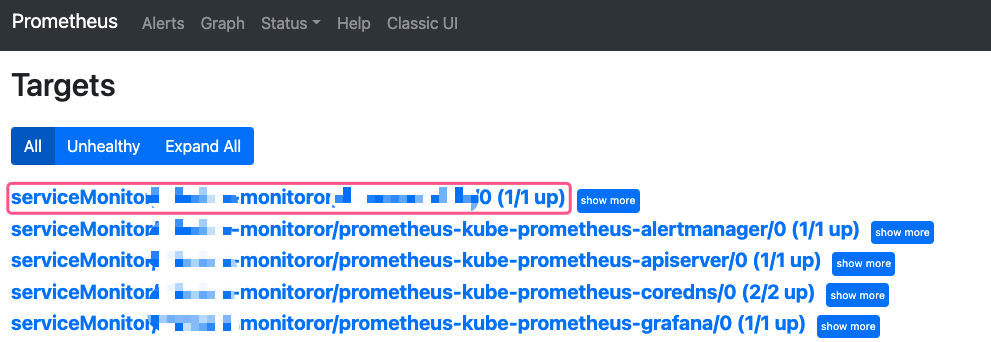
其实我们可以发现,默认已经有很多 target 都是通过 ServiceMonitor 实现的。
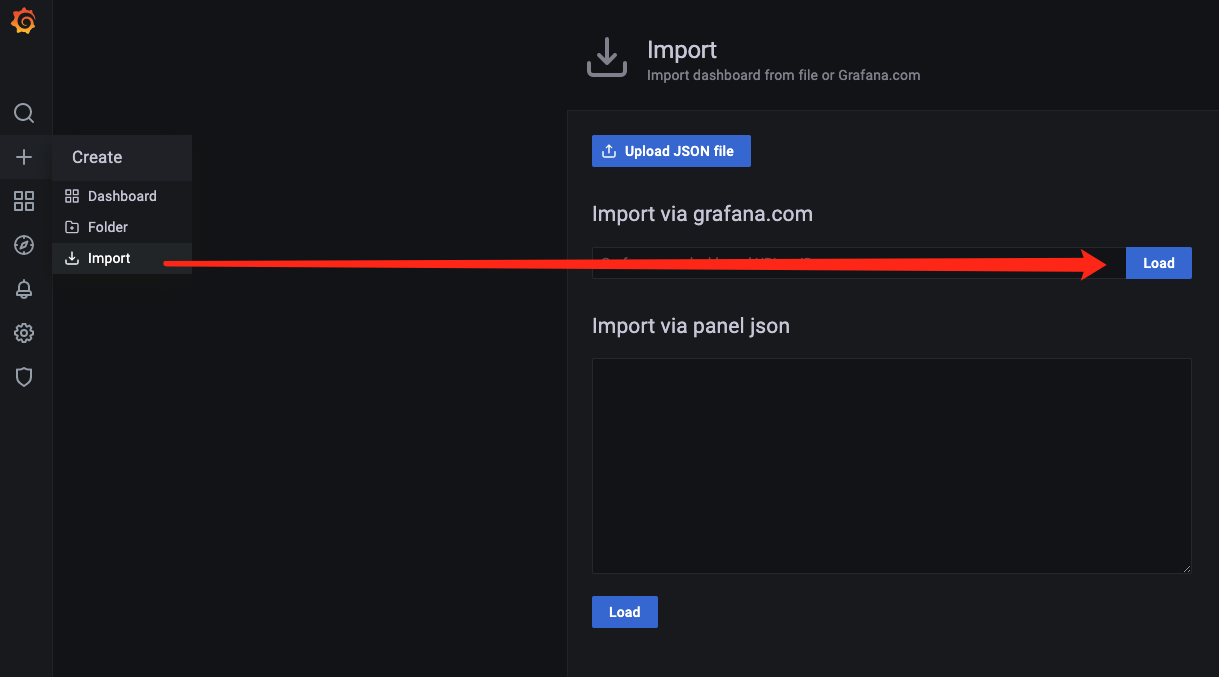
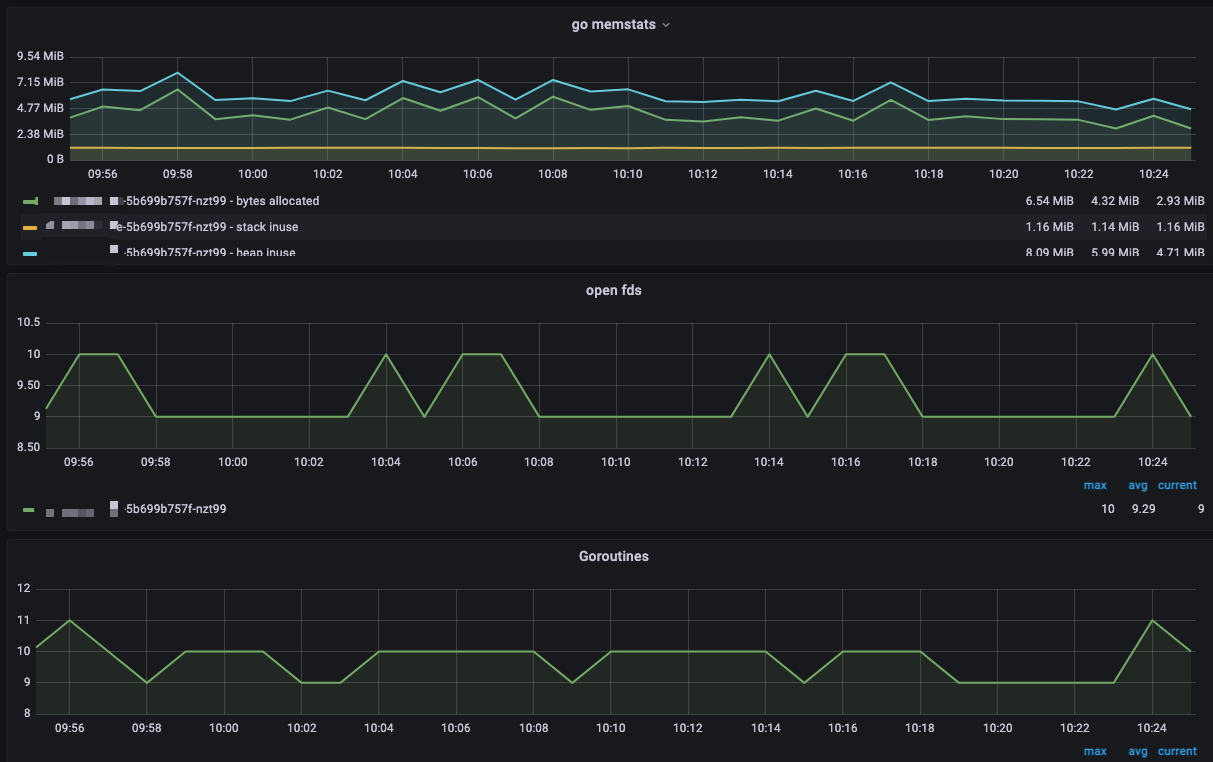
在 grafana 中配置对应图表
我这里使用的是官网中搜索的一个 go 的 runtime 监控图表,你可以根据你的实际情况选择你喜欢的,或者自定义,反正指标都已经有了
https://grafana.com/grafana/dashboards/6671
当然你可以在代码中暴露更多你所需要的指标,如计数器,连接数,用户等等相关指标,具体可以参考 prometheus 官方的样例
总结
直接部署在 k8s 内部的 prometheus 能很容易获取到 k8s 中各种指标和参数,使用 helm 部署也非常方便,基本一个命令就搞定了
如果你只需要基本的 cpu 和内存信息,那么这样就已经完全够用了,而如果针对你的 go 应用你需要更多的 runtime 或者 gc 方面的信息,那么你可以考虑暴露 metrics 然后自己配置 ServiceMonitor 来实现监控
参考链接
https://github.com/prometheus-community/helm-charts
https://github.com/prometheus/prometheus
多集群部署参考:https://www.servicemesher.com/blog/prometheus-monitor-k8s-1/
 微信
微信 支付宝
支付宝